Fresher data in your site’s Search Performance report
The Performance report helps webmasters and site owners better understand how their site performs on Google search, and answer questions such as:
- General stats: How much traffic did my site get from Search and Discover?
- Search queries: What are my site’s top and trending search queries?
- Top content: What are my site’s most successful pages on Google search?
- Site’s audiences: From which countries? From which devices – is it mostly mobile?
- Formats: What search formats does my site get (AMP, recipes, etc.) ?
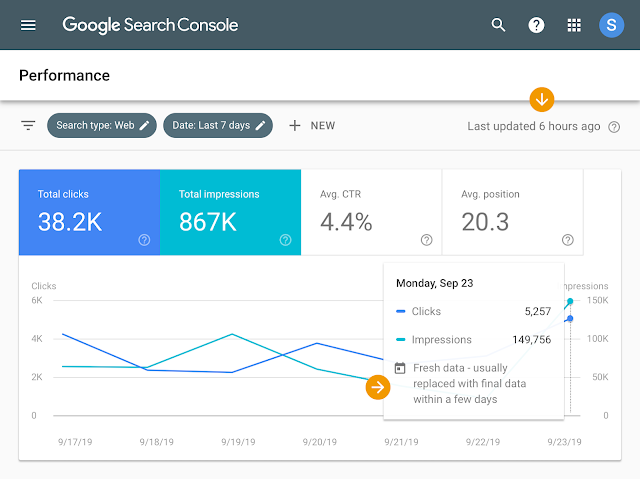
With the new fresh data, users can now see data as recent as less than a day old – a significant improvement compared to the previous few days.
We hope this improved data freshness allows you to better monitor and track your site’s performance and addresses some important needs such as:
- Seeing your weekend performance on Monday morning – no need to wait until Wednesday.
- Checking on your site’s stats first thing in the morning after, or even during, important days such as holidays, global events, and shopping days.
- Checking if your site’s traffic rebounds soon after fixing an important technical issue.
 |
| Fresh Data in Search Performance report |
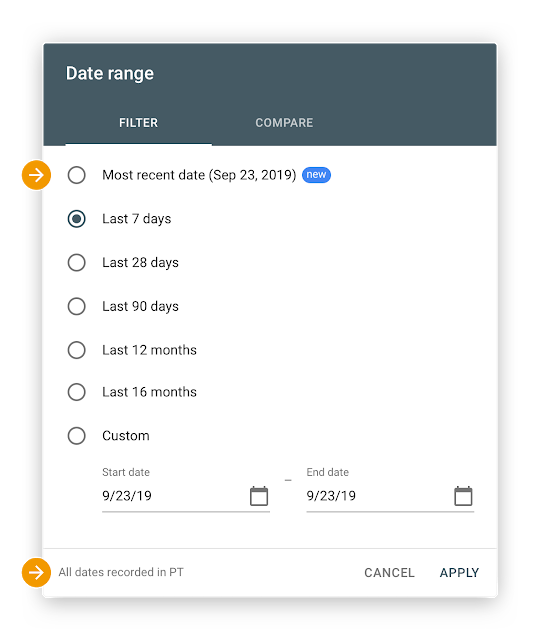
In addition, we updated the report to clearly communicate the data timezone (Pacific time zone). This is useful when you’d like to interpret the data compared to your local time zone or integrate it with other sources such as Google Analytics.
 |
| Performance report date picker |
Each fresh data point will be replaced with the final data point after a few days. It is expected that from time to time the fresh data might change a bit before being finalized.
The Search Analytics API does not support fresh data yet. In addition, fresh data is not available on the Discover performance report. As a result, properties that are eligible for Discover performance report will not see fresh data in their Overview report. We hope to address these items in the future.
Exporting performance data over time
We also heard your feedback about wanting a simple way to explore and export your performance over time. Starting today, this is possible. Simply choose ‘dates’ in the table below the graph, select the desired time frame, and explore the data in Search Console or export the chart. We hope that this new feature will help you further explore your performance trends and changes over time.
 |
| Performance report now with ‘dates’ table |
In conclusion
We hope that this new fresh data will help you better monitor your site’s performance and identify trends, patterns and interesting changes much closer to when they happen. In addition, we hope that the new date table dimension will assist you in exploring performance trends and changes over time. If you have any questions or concerns, please reach out on the Webmaster Help Forum or on Twitter
Posted by Ziv Hodak, Search Console product manager
